Building Intelligent Alert Systems: From Noise to Actionable Signals
In modern operational environments, thousands of alerts flood team notification channels every day. However, most SRE and operations engineers face the same dilemma: too many alerts, too little signal. When you're woken up for the tenth time at 3 AM by a false alarm, teams begin to lose trust in their alerting systems. This "alert fatigue" ultimately leads to real issues being overlooked.
Tianji, as an All-in-One monitoring platform, provides a complete solution from data collection to intelligent alerting. This article explores how to use Tianji to build an efficient alerting system where every alert deserves attention.
The Root Causes of Alert Fatigue
Core reasons why alerting systems fail typically include:
- Improper threshold settings: Static thresholds cannot adapt to dynamically changing business scenarios
- Lack of context: Isolated alert information makes it difficult to quickly assess impact scope and severity
- Duplicate alerts: One underlying issue triggers multiple related alerts, creating an information flood
- No priority classification: All alerts appear urgent, making it impossible to distinguish severity
- Non-actionable: Alerts only say "there's a problem" but provide no clues for resolution
Tianji's Intelligent Alerting Strategies
1. Multi-dimensional Data Correlation
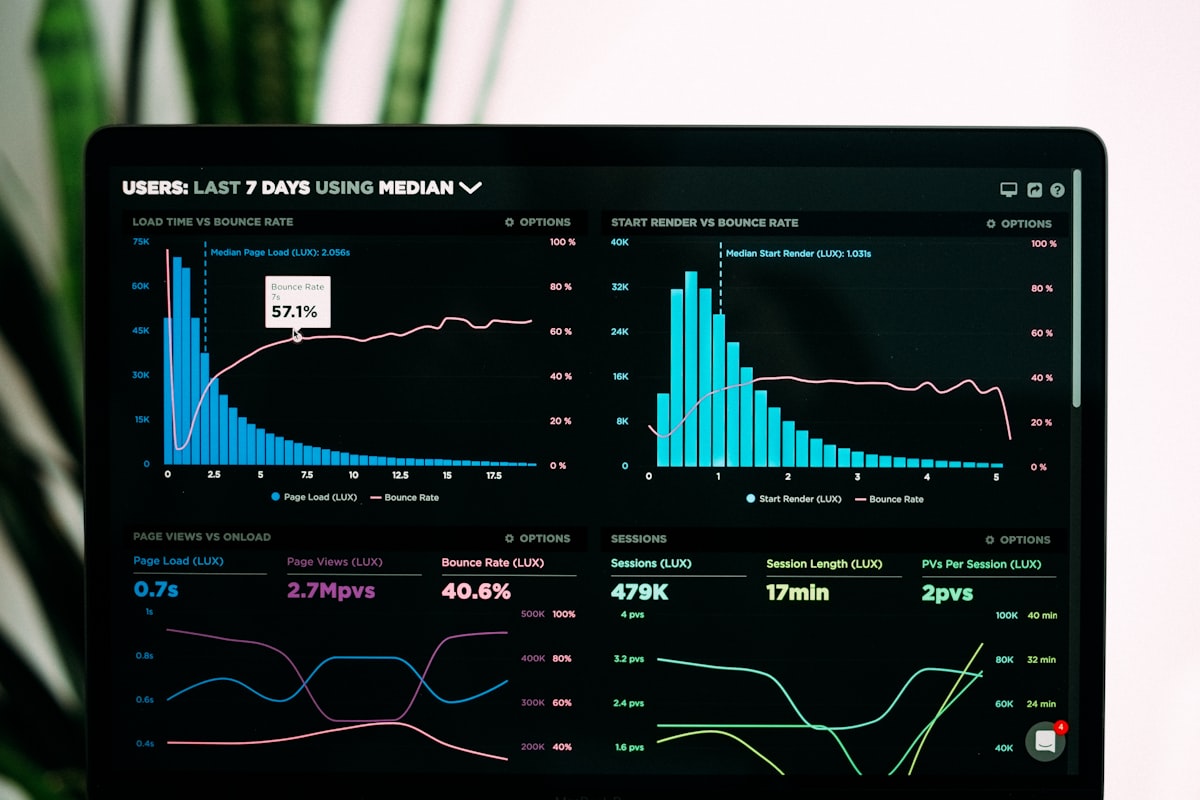
Tianji integrates three major capabilities—Website Analytics, Uptime Monitor, and Server Status—on the same platform, which means alerts can be based on comprehensive judgment across multiple data dimensions:
# Example scenario: Server response slowdown
- Server Status: CPU utilization at 85%
- Uptime Monitor: Response time increased from 200ms to 1500ms
- Website Analytics: User traffic surged by 300%

→ Tianji's intelligent assessment: This is a normal traffic spike, not a system failure
This correlation capability significantly reduces false positive rates, allowing teams to focus on issues that truly require attention.
2. Flexible Alert Routing and Grouping
Different alerts should notify different teams. Tianji supports multiple notification channels (Webhook, Slack, Telegram, etc.) and allows intelligent routing based on alert type, severity, impact scope, and other conditions:
- Critical level: Immediately notify on-call personnel, trigger pager
- Warning level: Send to team channel, handle during business hours
- Info level: Log for records, periodic summary reports

3. Alert Aggregation and Noise Reduction
When an underlying issue triggers multiple alerts, Tianji's alert aggregation feature can automatically identify correlations and merge multiple alerts into a single notification:
Original Alerts (5):
- API response timeout
- Database connection pool exhausted
- Queue message backlog
- Cache hit rate dropped
- User login failures increased

↓ After Tianji Aggregation

Consolidated Alert (1):
Core Issue: Database performance anomaly
Impact Scope: API, login, message queue
Related Metrics: 5 abnormal signals
Recommended Action: Check database connections and slow queries
4. Intelligent Silencing and Maintenance Windows
During planned maintenance, teams don't want to receive expected alerts. Tianji supports:
- Flexible silencing rules: Based on time, tags, resource groups, and other conditions
- Maintenance window management: Plan ahead, automatically silence related alerts
- Progressive recovery: Gradually restore monitoring after maintenance ends to avoid alert avalanches
Building Actionable Alerts
An excellent alert should contain:
- Clear problem description: Which service, which metric, current state
- Impact scope assessment: How many users affected, which features impacted
- Historical trend comparison: Is this a new issue or a recurring problem
- Related metrics snapshot: Status of other related metrics
- Handling suggestions: Recommended troubleshooting steps or Runbook links
Tianji's alert template system supports customizing this information, allowing engineers who receive alerts to take immediate action instead of spending significant time gathering context.

Implementation Best Practices
Define the Golden Rules of Alerting
When configuring alerts in Tianji, follow these principles:
- Every alert must be actionable: If you don't know what to do after receiving an alert, that alert shouldn't exist
- Avoid symptom-based alerts: Focus on root causes rather than surface phenomena
- Use percentages instead of absolute values: Adapt to system scale changes
- Set reasonable time windows: Avoid triggering alerts from momentary fluctuations
Continuously Optimize Alert Quality
Tianji provides alert effectiveness analysis features:
- Alert trigger statistics: Which alerts fire most frequently? Is it reasonable?
- Response time tracking: Average time from trigger to resolution
- False positive rate analysis: Which alerts are often ignored or immediately dismissed?
- Coverage assessment: Are real failures being missed by alerts?
Regularly review these metrics and continuously adjust alert rules to make the system smarter over time.
Quick Start with Tianji Alert System
# Download and start Tianji
wget https://raw.githubusercontent.com/msgbyte/tianji/master/docker-compose.yml
docker compose up -d
Default account: admin / admin (be sure to change the password)
Configuration workflow:
- Add monitoring targets: Websites, servers, API endpoints
- Set alert rules: Define thresholds and trigger conditions
- Configure notification channels: Connect Slack, Telegram, or Webhook
- Create alert templates: Customize alert message formats
- Test and verify: Manually trigger test alerts to ensure configuration is correct
Conclusion
An alerting system should not be a noise generator, but a reliable assistant for your team. Through Tianji's intelligent alerting capabilities, teams can:
- Reduce alert noise by over 70%: More precise trigger conditions and intelligent aggregation
- Improve response speed by 3x: Rich contextual information and actionable recommendations
- Enhance team happiness: Fewer invalid midnight calls, making on-call duty no longer a nightmare
Start today by building a truly intelligent alerting system with Tianji, making every alert worth your attention. Less noise, more insights—this is what modern monitoring should look like.