Lewati ke konten utama

Satu pos memiliki tag "Incident Response"

Lihat Semua Tag

Story-Driven Observability: Turning Tianji Dashboards into Decisions

· Satu menit membaca
Tianji Team
Product Insights

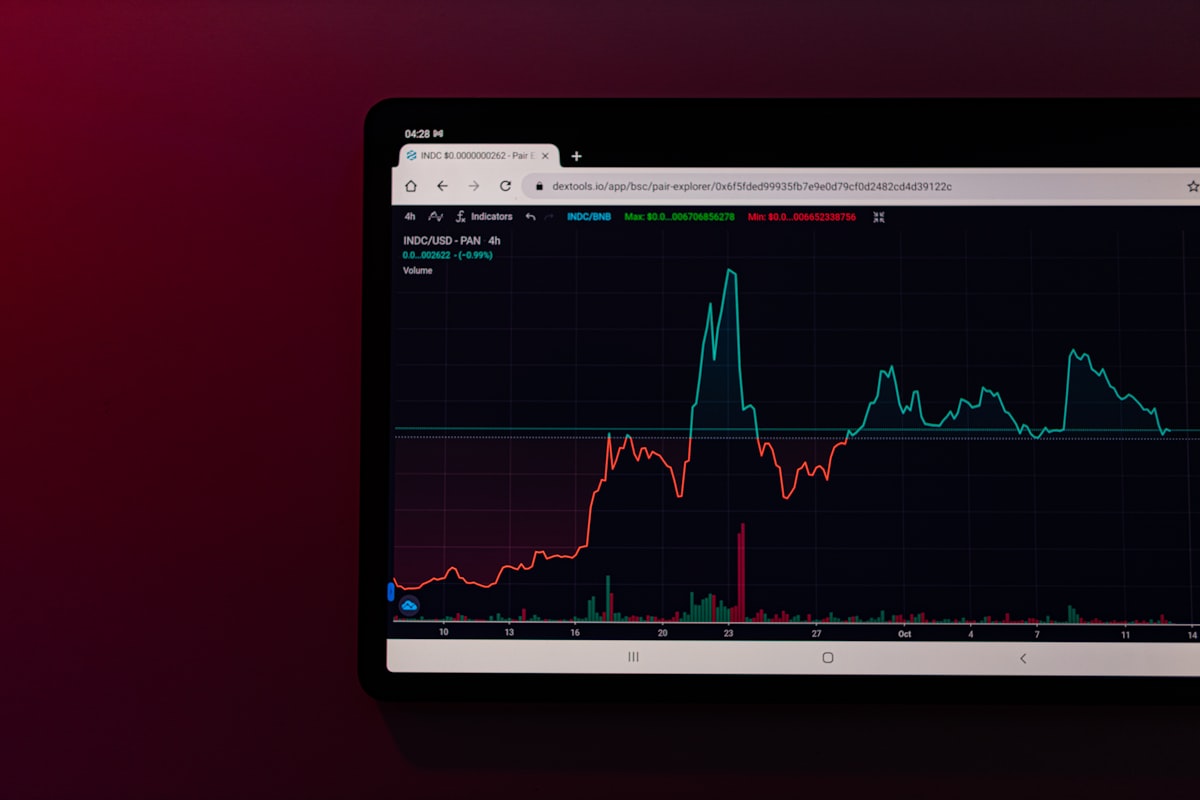
Observability dashboard highlighting performance trends

Organizations collect terabytes of metrics, traces, and logs every day, yet on-call engineers still ask the same question during incidents: What exactly is happening right now? Tianji was created to close this gap. By unifying website analytics, uptime monitoring, server status, and telemetry in one open-source platform, Tianji gives teams the context they need to act quickly.

From Raw Signals to Narrative Insight

Traditional observability setups scatter information across disconnected dashboards. Tianji avoids this fragmentation by correlating metrics, incidents, and user behavior in one timeline. When an alert fires, responders see the full story—response times, geographic impact, concurrent deployments, and even user journeys that led to errors.

This context makes handoffs faster. Instead of forwarding ten screenshots, teams can share a single Tianji incident view that highlights the relevant trends, suspected root causes, and user impact. The result is a shared understanding that accelerates triage.

Automating the First Draft of Postmortems

Tianji leverages AI summarization to turn monitoring data into human-readable briefings. Every alert can trigger an automated draft that captures key metrics, timeline milestones, and anomalous signals. Engineers can refine the draft rather than starting from scratch, reducing the time needed to publish reliable post-incident notes.

The same automation helps SRE teams run proactive health checks. Scheduled summaries highlight slow-burning issues—like growing latency or memory pressure—before they escalate. These narrative reports translate raw telemetry into action items that stakeholders outside the engineering team can understand.

Empowering Continuous Improvement

Story-driven observability is not only about speed; it also supports long-term learning. Tianji keeps historical incident narratives, linked to their corresponding dashboards and runbooks. Teams can review past incidents to see how similar signals played out, making it easier to avoid repeated mistakes.

That historical perspective informs capacity planning, reliability roadmaps, and even customer communications. With Tianji, organizations evolve from reactive firefighting to deliberate, data-informed decision making.

Getting Started with Tianji

Because Tianji is open source, teams can self-host the entire stack and adapt it to their infrastructure. Deploy the lightweight reporter to stream server status, configure website analytics in minutes, and integrate existing alerting channels. As coverage expands, Tianji becomes the single pane of glass that connects product metrics with operational health.

Ready to translate noise into narrative? Spin up Tianji, connect your services, and watch your observability practice transform from dashboard watching to decisive action.

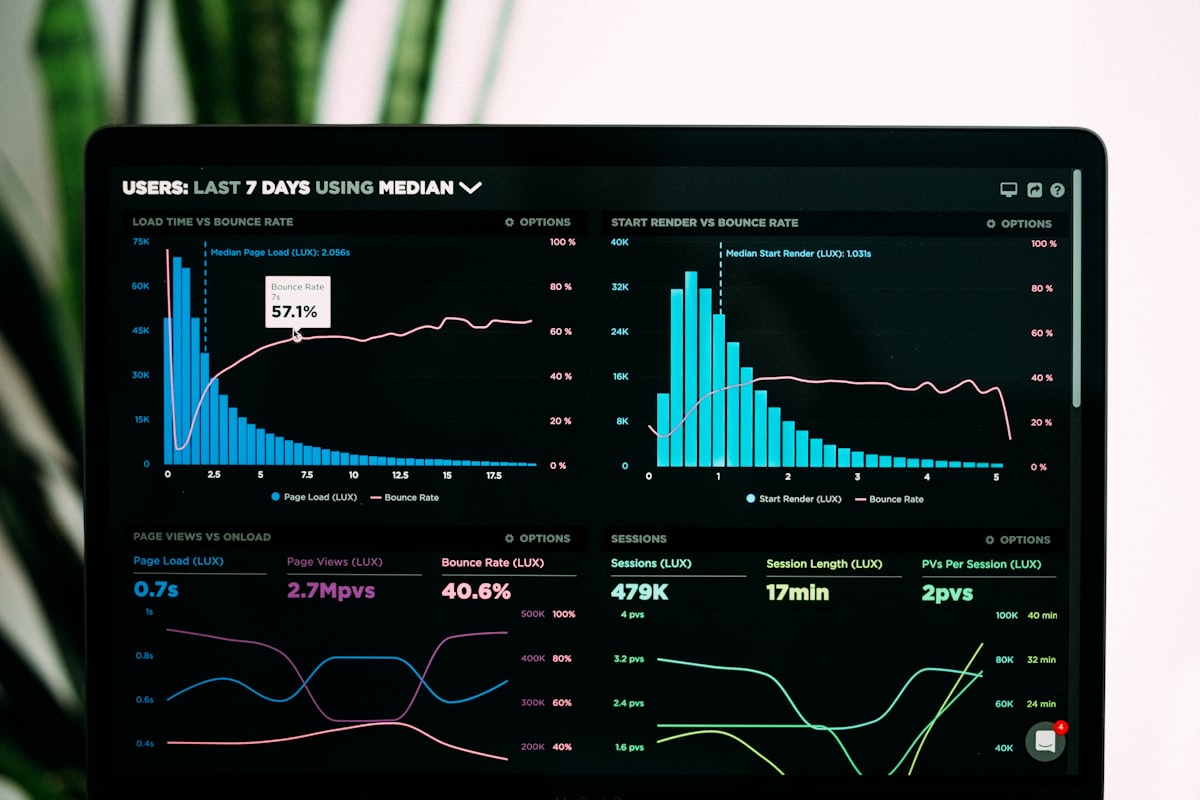
Avoiding Cascading Failures: Third‑party Dependency Monitoring That Actually Works

· Satu menit membaca

observability dashboards

Third‑party dependencies (auth, payments, CDNs, search, LLM APIs) are indispensable — and opaque. When they wobble, your app can fail in surprising ways: slow fallbacks, retry storms, cache stampedes, and silent feature degradation. The goal is not to eliminate external risk, but to make it visible, bounded, and quickly mitigated.

This post outlines a pragmatic approach to dependency‑aware monitoring and automation you can implement today with Tianji.

Why external failures cascade

  • Latency amplification: upstream 300–800 ms p95 spills into your end‑user p95.
  • Retry feedback loops: naive retries multiply load during partial brownouts.
  • Hidden coupling: one provider outage impacts multiple features at once.
  • Unknown blast radius: you discover the topology only after an incident.

Start with a topology and blast radius view

dependency topology

Build a simple dependency map: user flows → services → external providers. Tag each edge with SLOs and failure modes (timeouts, 4xx/5xx, quota, throttling). During incidents, this “where can it hurt?” view shortens time‑to‑mitigation.

With Tianji’s Unified Feed, you can fold provider checks, app metrics, and feature events into a single timeline to see impact and causality quickly.

Proactive signals: status pages aren’t enough

status and alerts

  • Poll provider status pages, but don’t trust them as sole truth.
  • Add synthetic checks from multiple regions against provider endpoints and critical flows.
  • Track error budgets separately for “external” vs “internal” failure classes to avoid masking.
  • Record quotas/limits (req/min, tokens/day) as first‑class signals to catch soft failures.

Measure what users feel, not just what providers return

Provider‑reported 200 OK with 2–3 s latency can still break user flows. Tie provider metrics to user funnels: search → add to cart → pay. Alert on delta between control and affected cohorts.

Incident playbooks for external outages

api and code

Focus on safe, reversible actions:

  • Circuit breakers + budgets: open after N failures/latency spikes; decay automatically.
  • Retry with jitter and caps; prefer idempotent semantics; collapse duplicate work.
  • Progressive degradation: serve cached/last‑known‑good; hide non‑critical features behind flags.
  • Traffic shaping: reduce concurrency towards the failing provider to protect your core.

How to ship this with Tianji

  • Unified Feed aggregates checks, metrics, and product events; fold signals by timeline for clear causality. See Feed State Model and Channels.
  • Synthetic monitors for external APIs and critical user journeys; multi‑region, cohort‑aware. See Custom Script Monitor.
  • Error‑budget tracking per dependency with burn alerts; correlate to user funnels.
  • Server Status Reporter to get essential host metrics fast. See Server Status Reporter.
  • Website tracking to instrument client‑side failures and measure real user impact. See Telemetry Intro and Website Tracking Script.

Implementation checklist

  • Enumerate external dependencies and map them to user‑visible features and SLOs
  • Create synthetic checks per critical API path (auth, pay, search) across regions
  • Define dependency‑aware alerting: error rate, P95, quota, throttling, and burn rates
  • Add circuit breakers and progressive degradation paths via feature flags
  • Maintain a unified incident timeline: signals → mitigations → outcomes; review and codify

Closing

datacenter cables

External dependencies are here to stay. The teams that win treat them as part of their system: measured, bounded, and automated. With Tianji’s dependency‑aware monitoring and unified timeline, you can turn opaque third‑party risk into fast, confident incident response.

Runbook Automation: Connect Detection → Diagnosis → Repair into a Closed Loop (Powered by a Unified Incident Timeline)

· Satu menit membaca

monitoring dashboards

“The alert fired—now what?” For many teams, the pain is not “Do we have monitoring?” but “How many people, tools, and context switches does it take to get from detection to repair?” This article uses a unified incident timeline as the backbone to connect detection → diagnosis → repair into an automated closed loop, so on-call SREs can focus on judgment rather than tab juggling.

Why build a closed loop

Without a unified context, three common issues plague response workflows:

  • Fragmented signals: metrics, logs, traces, and synthetic flows are split across tools.
  • Slow handoffs: alerts lack diagnostic context, causing repeated pings and evidence gathering.
  • Inconsistent actions: fixes are ad hoc; best practices don’t accumulate as reusable runbooks.

Closed-loop automation makes the “signals → decisions → actions” chain stable, auditable, and replayable by using a unified timeline as the spine.

How a unified incident timeline carries the response

control room comms

Key properties of the unified timeline:

  1. Correlation rules fold multi-source signals of the same root cause into one incident, avoiding alert storms.
  2. Each incident is auto-enriched with context (recent deploys, SLO burn, dependency health, hot metrics).
  3. Response actions (diagnostic scripts, rollback, scale-out, traffic shifting) are recorded on the same timeline for review and continuous improvement.

Five levels of runbook automation

server room cables

An evolution path from prompts to autonomy:

  1. Human-in-the-loop visualization: link charts and log slices on the timeline to cut context switching.
  2. Guided semi-automation: run diagnostic scripts on incident start (dependencies, thread dumps, slow queries).
  3. Conditional actions: execute low-risk fixes (rollback/scale/shift) behind guard conditions.
  4. Policy-driven orchestration: adapt by SLO burn, release windows, and dependency health.
  5. Guardrailed autonomy: self-heal within boundaries; escalate to humans beyond limits.

Automation is not “more scripts,” it’s “better triggers”

self-healing automation concept

High-quality triggers stem from high-quality signal design:

  • Anchor on SLOs: prioritize strong triggers on budget burn and user-impacting paths.
  • Adaptive sampling: full on failure paths, lower in steady state, temporary boosts after deploys.
  • Event folding: compress cascades (DB down → API 5xx → frontend errors) into a single incident so scripts don’t compete.

A practical Detection → Repair pattern

night collaboration

  1. Detect: synthetic flows or external probes fail on user-visible paths.
  2. Correlate: fold related signals on one timeline; auto-escalate when SLO thresholds are at risk.
  3. Diagnose: run scripts in parallel for dependency health, recent deploys, slow queries, hot keys, and thread stacks.
  4. Repair: if guard conditions pass, execute rollback/scale/shift/restart on scoped units; otherwise require human approval.
  5. Review: actions, evidence, and outcomes live on the same timeline to improve the next response.

Implement quickly with Tianji

Implementation checklist (check as you go)

  • Map critical user journeys and SLOs; define guard conditions for safe automation
  • Ingest checks, metrics, deploys, dependencies, and product events into a single timeline
  • Build a library of diagnostic scripts and low-risk repair actions
  • Configure incident folding and escalation to avoid alert storms
  • Switch sampling and thresholds across release windows and traffic peaks/valleys
  • After each incident, push more steps into automation with guardrails

Closing thoughts

Runbook automation is not “shipping a giant orchestrator in one go.” It starts with a unified timeline and turns common response paths into workflows that are visible, executable, verifiable, and evolvable. With Tianji’s open building blocks, you can safely delegate repetitive work to automation and keep human focus on real decisions.