Lewati ke konten utama

Story-Driven Observability: Turning Tianji Dashboards into Decisions

· Satu menit membaca
Tianji Team
Product Insights

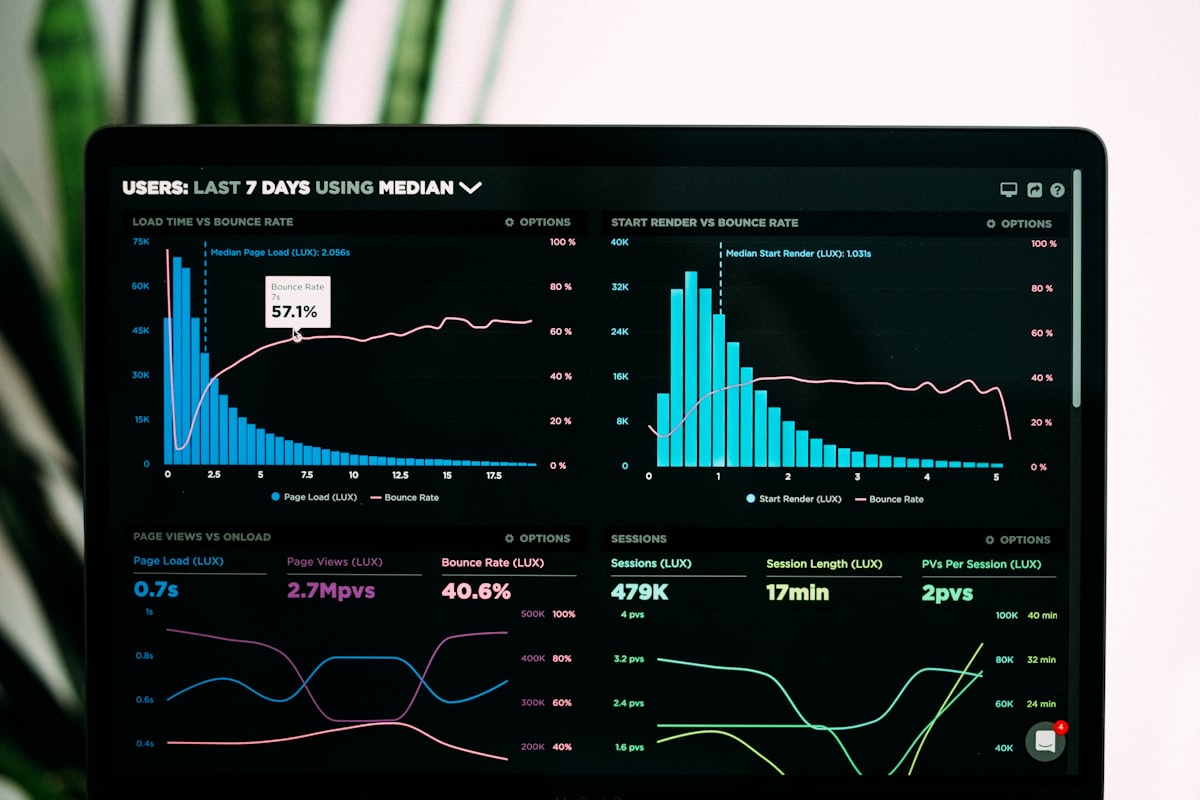
Observability dashboard highlighting performance trends

Organizations collect terabytes of metrics, traces, and logs every day, yet on-call engineers still ask the same question during incidents: What exactly is happening right now? Tianji was created to close this gap. By unifying website analytics, uptime monitoring, server status, and telemetry in one open-source platform, Tianji gives teams the context they need to act quickly.

From Raw Signals to Narrative Insight

Traditional observability setups scatter information across disconnected dashboards. Tianji avoids this fragmentation by correlating metrics, incidents, and user behavior in one timeline. When an alert fires, responders see the full story—response times, geographic impact, concurrent deployments, and even user journeys that led to errors.

This context makes handoffs faster. Instead of forwarding ten screenshots, teams can share a single Tianji incident view that highlights the relevant trends, suspected root causes, and user impact. The result is a shared understanding that accelerates triage.

Automating the First Draft of Postmortems

Tianji leverages AI summarization to turn monitoring data into human-readable briefings. Every alert can trigger an automated draft that captures key metrics, timeline milestones, and anomalous signals. Engineers can refine the draft rather than starting from scratch, reducing the time needed to publish reliable post-incident notes.

The same automation helps SRE teams run proactive health checks. Scheduled summaries highlight slow-burning issues—like growing latency or memory pressure—before they escalate. These narrative reports translate raw telemetry into action items that stakeholders outside the engineering team can understand.

Empowering Continuous Improvement

Story-driven observability is not only about speed; it also supports long-term learning. Tianji keeps historical incident narratives, linked to their corresponding dashboards and runbooks. Teams can review past incidents to see how similar signals played out, making it easier to avoid repeated mistakes.

That historical perspective informs capacity planning, reliability roadmaps, and even customer communications. With Tianji, organizations evolve from reactive firefighting to deliberate, data-informed decision making.

Getting Started with Tianji

Because Tianji is open source, teams can self-host the entire stack and adapt it to their infrastructure. Deploy the lightweight reporter to stream server status, configure website analytics in minutes, and integrate existing alerting channels. As coverage expands, Tianji becomes the single pane of glass that connects product metrics with operational health.

Ready to translate noise into narrative? Spin up Tianji, connect your services, and watch your observability practice transform from dashboard watching to decisive action.

One Stack for Website Analytics, Uptime, and Server Health: All‑in‑One Observability with Tianji

· Satu menit membaca

analytics dashboard

When you put product analytics, uptime monitoring, and server health on the same observability surface, you find issues faster, iterate more confidently, and make the right calls within privacy and compliance boundaries. Tianji combines Website Analytics + Uptime Monitor + Server Status into one platform, giving teams end‑to‑end insights with a lightweight setup.

Why an all‑in‑one observability layer

  • Fewer context switches: From traffic to availability without hopping across tools.
  • Unified semantics: One set of events and dimensions; metrics connect across layers.
  • Privacy‑first: Cookie‑less by default, with IP truncation, minimization, and aggregation.
  • Self‑hosting optional: Clear boundaries to meet compliance and data residency needs.

privacy lock

The signals you actually need

  • Product analytics: Pageviews, sessions, referrers/UTM, conversions and drop‑offs on critical paths.
  • Uptime monitoring: Reachability, latency, error rates; sliced by region and ISP.
  • Server health: CPU/memory/disk/network essentials with threshold‑based alerts.
  • Notification & collaboration: Route via Webhook/Slack/Telegram, with noise control.

How Tianji delivers it

Tianji ships three capabilities in one platform:

  1. Website analytics: Lightweight script, cookie‑less collection; default aggregation and retention policies.
  2. Uptime monitoring: Passive/active compatible, with built‑in status pages and regional views.
  3. Server status: Unified reporting and visualization; open APIs for audits and export.

Privacy by design is on by default: IP truncation, geo mapping, and minimal storage, with options for self‑hosting and region‑pinned deployments.

3‑minute quickstart

wget https://raw.githubusercontent.com/msgbyte/tianji/master/docker-compose.yml
docker compose up -d

The default account is admin/admin. Change the password promptly and set up your first site and monitors.

Common rollout patterns

server lights

  • Small teams/indies: Single‑host self‑deployment with out‑of‑the‑box end‑to‑end signals.
  • Mid‑size SaaS: Consolidate funnels, SLAs, and server alerts into a single alerting layer to cut false positives.
  • Open‑source self‑host: Public status pages outside, fine‑grained metrics and audit‑friendly exports inside.

Best‑practice checklist

  • Define 3–5 critical funnels and track only decision‑relevant events.
  • Enable IP truncation and set retention (e.g., 30 days for raw events, 180 days for aggregates).
  • Use referrer/UTM cohorts for growth analysis; avoid individual identification.
  • Separate public status pages from internal alerts to reduce exposure.
  • Review monthly: decision value vs. data cost — trim aggressively.

Closing

Seeing product and reliability on the same canvas is a more efficient way to collaborate. With Tianji, teams get fewer‑noise, action‑ready signals — all with privacy and compliance first.

Privacy‑first Website Analytics, Without the Creepiness

· Satu menit membaca

privacy lock and data

Most teams want trustworthy product signals without shadow‑tracking their users. This post outlines how to run a privacy‑first analytics stack that is cookie‑less, IP‑anonymized, and compliant by default — and how Tianji helps you ship that in minutes.

What “privacy‑first” really means

  • No third‑party cookies or fingerprinting
  • IP and geo anonymization at ingestion time
  • Minimization and aggregation by default (store only what you act on)
  • Short retention windows with configurable TTLs
  • Clear data governance: self‑hosted or region‑pinned

you are being watched vs privacy

Privacy is not the absence of insight. It is the discipline to collect the minimum, aggregate early, and keep identities out of the loop unless users explicitly consent.

What you still get (and need) for product decisions

analytics dashboards

  • Page views, sessions, referrers, UTM cohorts (sans cookies)
  • Conversion funnels and drop‑offs on critical paths
  • Lightweight event telemetry for product behaviors
  • Country/region trends with differential privacy techniques
  • Content insights that help editorial and SEO without tracking people

How Tianji implements privacy by design

Tianji bundles Website Analytics + Uptime Monitor + Server Status into one platform, so you get product and reliability signals together — without data sprawl.

  1. Cookie‑less tracking script with hashing and salt rotation
  2. IP truncation and geo mapping via in‑house database
  3. Aggregation and TTL policies at the storage layer
  4. Self‑host, air‑gapped, or region‑pinned deployments
  5. Open APIs and export for audits

See docs: Website Tracking Script, Telemetry Intro, and Server Status Reporter.

Deployment options (pick your trust boundary)

on‑prem server lights

  • Self‑host with Docker Compose for full data control
  • Region‑pinned cloud install if you prefer managed ops
  • Hybrid: analytics in‑house, public status pages outside

Install in minutes:

wget https://raw.githubusercontent.com/msgbyte/tianji/master/docker-compose.yml
docker compose up -d

Default account is admin/admin — remember to change the password.

Policy templates you can copy

Use these defaults to start, then tighten as needed:

  • Retention: 30 days for raw events, 180 days for aggregates
  • IP handling: drop last 2 octets (IPv4) or /64 (IPv6)
  • PII: deny‑list at ingestion; allow only hashed user IDs under consent
  • Geography: pin storage to your primary user region
  • Access: least privilege with audit logging enabled

Implementation checklist

  • Map your product’s critical funnels and decide what to measure
  • Deploy Tianji with cookie‑less website tracking and telemetry events
  • Turn on IP truncation, geo anonymization, and retention TTLs
  • Build cohorts by campaign and page groups, not people
  • Review monthly: decision value vs. data cost — trim aggressively

Closing

privacy culture

Privacy‑first analytics is not just possible — it’s the default you should expect. With Tianji, you get actionable product and reliability signals without surveilling users. Less creepiness, more clarity.

Avoiding Cascading Failures: Third‑party Dependency Monitoring That Actually Works

· Satu menit membaca

observability dashboards

Third‑party dependencies (auth, payments, CDNs, search, LLM APIs) are indispensable — and opaque. When they wobble, your app can fail in surprising ways: slow fallbacks, retry storms, cache stampedes, and silent feature degradation. The goal is not to eliminate external risk, but to make it visible, bounded, and quickly mitigated.

This post outlines a pragmatic approach to dependency‑aware monitoring and automation you can implement today with Tianji.

Why external failures cascade

  • Latency amplification: upstream 300–800 ms p95 spills into your end‑user p95.
  • Retry feedback loops: naive retries multiply load during partial brownouts.
  • Hidden coupling: one provider outage impacts multiple features at once.
  • Unknown blast radius: you discover the topology only after an incident.

Start with a topology and blast radius view

dependency topology

Build a simple dependency map: user flows → services → external providers. Tag each edge with SLOs and failure modes (timeouts, 4xx/5xx, quota, throttling). During incidents, this “where can it hurt?” view shortens time‑to‑mitigation.

With Tianji’s Unified Feed, you can fold provider checks, app metrics, and feature events into a single timeline to see impact and causality quickly.

Proactive signals: status pages aren’t enough

status and alerts

  • Poll provider status pages, but don’t trust them as sole truth.
  • Add synthetic checks from multiple regions against provider endpoints and critical flows.
  • Track error budgets separately for “external” vs “internal” failure classes to avoid masking.
  • Record quotas/limits (req/min, tokens/day) as first‑class signals to catch soft failures.

Measure what users feel, not just what providers return

Provider‑reported 200 OK with 2–3 s latency can still break user flows. Tie provider metrics to user funnels: search → add to cart → pay. Alert on delta between control and affected cohorts.

Incident playbooks for external outages

api and code

Focus on safe, reversible actions:

  • Circuit breakers + budgets: open after N failures/latency spikes; decay automatically.
  • Retry with jitter and caps; prefer idempotent semantics; collapse duplicate work.
  • Progressive degradation: serve cached/last‑known‑good; hide non‑critical features behind flags.
  • Traffic shaping: reduce concurrency towards the failing provider to protect your core.

How to ship this with Tianji

  • Unified Feed aggregates checks, metrics, and product events; fold signals by timeline for clear causality. See Feed State Model and Channels.
  • Synthetic monitors for external APIs and critical user journeys; multi‑region, cohort‑aware. See Custom Script Monitor.
  • Error‑budget tracking per dependency with burn alerts; correlate to user funnels.
  • Server Status Reporter to get essential host metrics fast. See Server Status Reporter.
  • Website tracking to instrument client‑side failures and measure real user impact. See Telemetry Intro and Website Tracking Script.

Implementation checklist

  • Enumerate external dependencies and map them to user‑visible features and SLOs
  • Create synthetic checks per critical API path (auth, pay, search) across regions
  • Define dependency‑aware alerting: error rate, P95, quota, throttling, and burn rates
  • Add circuit breakers and progressive degradation paths via feature flags
  • Maintain a unified incident timeline: signals → mitigations → outcomes; review and codify

Closing

datacenter cables

External dependencies are here to stay. The teams that win treat them as part of their system: measured, bounded, and automated. With Tianji’s dependency‑aware monitoring and unified timeline, you can turn opaque third‑party risk into fast, confident incident response.

Release‑aware Monitoring: Watch Every Deploy Smarter

· Satu menit membaca

observability dashboards

Most monitoring setups work fine in steady state, yet fall apart during releases: thresholds misfire, samples miss the key moments, and alert storms hide real issues. Release‑aware monitoring brings “release context” into monitoring decisions—adjusting sampling/thresholds across pre‑, during‑, and post‑deploy phases, folding related signals, and focusing on what truly impacts SLOs.

Why “release‑aware” matters

  • Deploys are high‑risk windows with parameter, topology, and traffic changes.
  • Static thresholds (e.g., fixed P95) produce high false‑positive rates during rollouts.
  • Canary/blue‑green needs cohort‑aware dashboards and alerting strategies.

The goal: inject “just released?”, “traffic split”, “feature flags”, and “target cohorts” into alerting and sampling logic to increase sensitivity where it matters and suppress noise elsewhere.

What release context includes

feature flags toggle

  • Commits/tickets: commit, PR, ticket, version
  • Deploy metadata: start/end time, environment, batch, blast radius
  • Traffic strategy: canary ratio, blue‑green switch, rollback points
  • Feature flags: on/off, cohort targeting, dependent flags
  • SLO context: error‑budget burn, critical paths, recent incidents

A practical pre‑/during‑/post‑deploy policy

Before deploy (prepare)

  • Temporarily raise sampling for critical paths to increase metric resolution.
  • Switch thresholds to “release‑phase curves” to reduce noise from short spikes.
  • Pre‑warm runbooks: prepare diagnostics (dependency health, slow queries, hot keys, thread stacks).

During deploy (canary/blue‑green)

canary release metaphor

  • Fire strong alerts only on “canary cohort” SLO funnels; compare “control vs canary.”
  • At traffic shift points, temporarily raise sampling and log levels to capture root causes.
  • Define guard conditions (error rate↑, P95↑, success↓, funnel conversion↓) to auto‑rollback or degrade.

After deploy (observe and converge)

  • Gradually return to steady‑state sampling/thresholds; keep short‑term focus on critical paths.
  • Fold “release events + metrics + alerts + actions” into one timeline for review and learning.

Incident folding and timeline: stop alert storms

timeline and graphs

  • Fold multi‑source signals of the same root cause (DB jitter → API 5xx → frontend errors) into a single incident.
  • Attach release context (version, traffic split, feature flags) to the incident for one‑view investigation.
  • Record diagnostics and repair actions on the same timeline for replay and continuous improvement.

Ship it with Tianji

Implementation checklist

  • Map critical paths and SLOs; define “release‑phase thresholds/sampling” and guard conditions
  • Ingest release context (version, traffic split, flags, cohorts) as labels on events/metrics
  • Build “canary vs control” dashboards and delta‑based alerts
  • Auto bump sampling/log levels at shift/rollback points, then decay to steady state
  • Keep a unified timeline of “signals → actions → outcomes”; review after each release and codify into runbooks

Closing

on-call night ops

Release‑aware monitoring is not “more dashboards and alerts,” but making “releases” first‑class in monitoring and automation. With Tianji’s unified timeline and open telemetry, you can surface issues earlier, converge faster, and keep human effort focused on real judgment and trade‑offs.

Runbook Automation: Connect Detection → Diagnosis → Repair into a Closed Loop (Powered by a Unified Incident Timeline)

· Satu menit membaca

monitoring dashboards

“The alert fired—now what?” For many teams, the pain is not “Do we have monitoring?” but “How many people, tools, and context switches does it take to get from detection to repair?” This article uses a unified incident timeline as the backbone to connect detection → diagnosis → repair into an automated closed loop, so on-call SREs can focus on judgment rather than tab juggling.

Why build a closed loop

Without a unified context, three common issues plague response workflows:

  • Fragmented signals: metrics, logs, traces, and synthetic flows are split across tools.
  • Slow handoffs: alerts lack diagnostic context, causing repeated pings and evidence gathering.
  • Inconsistent actions: fixes are ad hoc; best practices don’t accumulate as reusable runbooks.

Closed-loop automation makes the “signals → decisions → actions” chain stable, auditable, and replayable by using a unified timeline as the spine.

How a unified incident timeline carries the response

control room comms

Key properties of the unified timeline:

  1. Correlation rules fold multi-source signals of the same root cause into one incident, avoiding alert storms.
  2. Each incident is auto-enriched with context (recent deploys, SLO burn, dependency health, hot metrics).
  3. Response actions (diagnostic scripts, rollback, scale-out, traffic shifting) are recorded on the same timeline for review and continuous improvement.

Five levels of runbook automation

server room cables

An evolution path from prompts to autonomy:

  1. Human-in-the-loop visualization: link charts and log slices on the timeline to cut context switching.
  2. Guided semi-automation: run diagnostic scripts on incident start (dependencies, thread dumps, slow queries).
  3. Conditional actions: execute low-risk fixes (rollback/scale/shift) behind guard conditions.
  4. Policy-driven orchestration: adapt by SLO burn, release windows, and dependency health.
  5. Guardrailed autonomy: self-heal within boundaries; escalate to humans beyond limits.

Automation is not “more scripts,” it’s “better triggers”

self-healing automation concept

High-quality triggers stem from high-quality signal design:

  • Anchor on SLOs: prioritize strong triggers on budget burn and user-impacting paths.
  • Adaptive sampling: full on failure paths, lower in steady state, temporary boosts after deploys.
  • Event folding: compress cascades (DB down → API 5xx → frontend errors) into a single incident so scripts don’t compete.

A practical Detection → Repair pattern

night collaboration

  1. Detect: synthetic flows or external probes fail on user-visible paths.
  2. Correlate: fold related signals on one timeline; auto-escalate when SLO thresholds are at risk.
  3. Diagnose: run scripts in parallel for dependency health, recent deploys, slow queries, hot keys, and thread stacks.
  4. Repair: if guard conditions pass, execute rollback/scale/shift/restart on scoped units; otherwise require human approval.
  5. Review: actions, evidence, and outcomes live on the same timeline to improve the next response.

Implement quickly with Tianji

Implementation checklist (check as you go)

  • Map critical user journeys and SLOs; define guard conditions for safe automation
  • Ingest checks, metrics, deploys, dependencies, and product events into a single timeline
  • Build a library of diagnostic scripts and low-risk repair actions
  • Configure incident folding and escalation to avoid alert storms
  • Switch sampling and thresholds across release windows and traffic peaks/valleys
  • After each incident, push more steps into automation with guardrails

Closing thoughts

Runbook automation is not “shipping a giant orchestrator in one go.” It starts with a unified timeline and turns common response paths into workflows that are visible, executable, verifiable, and evolvable. With Tianji’s open building blocks, you can safely delegate repetitive work to automation and keep human focus on real decisions.

Cost-Aware Observability: Keep Your SLOs While Cutting Cloud Spend

· Satu menit membaca

observability dashboard

Cloud costs are rising, data volumes keep growing, and yet stakeholders expect faster incident response with higher reliability. The answer is not “more data” but the right data at the right price. Cost-aware observability helps you preserve signals that protect user experience while removing expensive noise.

This guide shows how to re-think telemetry collection, storage, and alerting so you can keep your SLOs intact—without burning your budget.

Why Cost-Aware Observability Matters

Traditional monitoring stacks grew by accretion: another exporter here, a new trace sampler there, duplicated logs everywhere. The result is ballooning ingest and storage costs, slow queries, and alert fatigue. A cost-aware approach prioritizes:

  • Mission-critical signals tied to user outcomes (SLOs)
  • Economic efficiency across ingest, storage, and query paths
  • Progressive detail: coarse first, deep when needed (on-demand)
  • Tool consolidation and data ownership to avoid vendor lock-in

Principles to Guide Decisions

  1. Minimize before you optimize: remove duplicated and low-value streams first.
  2. Tie signals to SLOs: if a metric or alert cannot impact a decision, reconsider it.
  3. Prefer structured events over verbose logs for business and product telemetry.
  4. Use adaptive sampling: full fidelity when failing, economical during steady state.
  5. Keep raw where it’s cheap, index where it’s valuable.

cloud cost optimization concept

Practical Tactics That Save Money (Without Losing Signals)

1) Right-size logging

  • Convert repetitive text logs to structured events with bounded cardinality.
  • Drop high-chattiness DEBUG in production by default; enable targeted DEBUG windows when investigating.
  • Use log levels to route storage: “hot” for incidents, “warm” for audits, “cold” for long-term.

2) Adaptive trace sampling

  • Keep 100% sampling on error paths, retries, and SLO-adjacent routes.
  • Reduce sampling for healthy, high-volume endpoints; increase on anomaly detection.
  • Elevate sampling automatically when deploys happen or SLO burn accelerates.

3) Metrics with budgets

  • Prefer low-cardinality service-level metrics (availability, latency P95/P99, error rate).
  • Add usage caps per namespace or team to prevent runaway time-series.
  • Promote derived, decision-driving metrics to dashboards; demote vanity metrics.

4) Event-first product telemetry

  • Track business outcomes with compact events (e.g., signup_succeeded, api_call_ok).
  • Enrich events once at ingest; avoid re-parsing massive log lines later.
  • Use event retention tiers that match analysis windows (e.g., 90 days for product analytics).

A Cost-Efficient Observability Architecture

data pipeline concept

A practical pattern:

  • Edge ingestion with lightweight filters (drop obvious noise early)
  • Split paths: metrics → time-series DB; traces → sampled store; events → columnar store
  • Cold object storage for raw, cheap retention; hot indices for incident triage
  • Query federation so responders see a single timeline across signals

This architecture supports “zoom in on demand”: start with an incident’s SLO breach, then progressively load traces, logs, and events only when necessary.

Budget Policies and Alerting That Respect Humans (and Wallets)

PolicyExampleOutcome
Usage guardrailsEach team gets a monthly metric-cardinality quotaPredictable spend; fewer accidental explosions
SLO-driven pagingPage only on error budget burn and sustained latency breachesFewer false pages, faster MTTR
Deploy-aware boostsTemporarily increase sampling right after releasesHigh-fidelity data when it matters
Auto-archivalMove logs older than 14 days to cold storageLarge savings with no impact on incidents

Pair these with correlation-based alerting. Collapse cascades (DB down → API 5xx → frontend errors) into a single incident to reduce noise and investigation time.

server racks for storage tiers

How Tianji Helps You Do More With Less

With Tianji, you keep data ownership and can tune which signals to collect, retain, and correlate—without shipping every byte to expensive proprietary backends.

Implementation Checklist

  • Inventory all telemetry producers; remove duplicates and unused streams
  • Define SLOs per critical user journey; map signals to decisions
  • Set default sampling, then add automatic boosts on deploys and anomalies
  • Apply cardinality budgets; alert on budget burn, not just raw spikes
  • Route storage by value (hot/warm/cold); add auto-archival policies
  • Build correlation rules to collapse cascades into single incidents

team aligning around cost-aware plan

Key Takeaways

  1. Cost-aware observability focuses on signals that protect user experience.
  2. Use adaptive sampling and storage tiering to control spend without losing fidelity where it matters.
  3. Correlate signals into a unified timeline to cut noise and accelerate root-cause analysis.
  4. Tianji helps you implement these patterns with open, flexible building blocks you control.

Reducing Alert Fatigue: Turning Noise into Actionable Signals

· Satu menit membaca

Alert fatigue happens when teams receive so many notifications that the truly critical ones get buried. The result: slow responses, missed incidents, and burned-out engineers. The goal of a modern alerting system is simple: only wake humans when action is required, include rich context to shorten time to resolution, and suppress everything else.

monitoring dashboard with charts

Why Alert Fatigue Happens

Most organizations unintentionally create noisy alerting ecosystems. Common causes include:

  1. Static thresholds that ignore diurnal patterns and seasonal traffic.
  2. Duplicate alerts across tools without correlation or deduplication.
  3. Health checks that confirm liveness but not correctness of user flows.
  4. Paging for warnings instead of issues requiring immediate human action.
  5. Missing maintenance windows and deployment-aware mute rules.

When every blip pages the on-call, people quickly learn to ignore pages—and that is the fastest way to miss real outages.

Start With SLOs and Error Budgets

Service Level Objectives (SLOs) translate reliability goals into measurable targets. Error budgets (the allowable unreliability) help decide when to slow releases and when to page.

  • Define user-centric SLOs: availability for core endpoints, latency at P95/P99, success rates for critical flows.
  • Set page conditions based on budget burn rate, not just instantaneous values.
  • Prioritize business-critical paths over peripheral features.
Objective TypeExample SLOPage When
Availability99.95% monthlyError budget burn rate > 2% in 1 hour
LatencyP95 < 400ms for /checkoutSustained breach for 10 minutes across 3 regions
Success Rate99.9% for login flowDrop > 0.5% with concurrent spike in 5xx

data center server racks

Design Principles for Actionable Alerts

  1. Page only for human-actionable issues. Everything else goes to review queues (email/Slack) or is auto-remediated.
  2. Use correlation to reduce noise. Group related symptoms (API 5xx, DB latency, queue backlog) into a single incident.
  3. Include diagnostic context in the first alert: recent deploy, top failing endpoints, region breakdown, related logs/metrics.
  4. Implement escalation policies with rate limiting and cool-downs.
  5. Respect maintenance windows and deploy windows automatically.
  6. Use multi-signal detection: combine synthetic checks, server metrics, and real user signals (RUM/telemetry).

From Reactive to Proactive: Synthetic + Telemetry

Reactive alerting waits for failures. Proactive systems combine synthetic monitoring (to test critical paths) and telemetry (to see real user impact).

  • Synthetic monitoring validates complete flows: login → action → confirmation.
  • Real User Monitoring reveals device/network/browser-specific degradations.
  • Cross-region checks detect localized issues (DNS/CDN/regional outages).

With Tianji you can combine these signals in a unified timeline so responders see cause and effect in one place. See: Feed overview, State model, and Channels.

alert warning on dashboard

Building a Quiet, Reliable On-Call

Implement these patterns to cut noise while improving MTTR:

1) Explicit Alert Taxonomy

  • Critical: Page immediately; human action required; data loss/security/major outage.
  • High: Notify on-call during business hours; fast follow-up; customer-impacting but contained.
  • Info/Review: No page; log to feed; analyzed in post-incident or weekly review.

2) Deploy-Aware Alerting

  • Tag telemetry and alerts with release versions and feature flags.
  • Auto-create canary guardrails and roll back on breach.

3) Correlation and Deduplication

  • Collapse cascades (e.g., DB down → API 5xx → frontend errors) into one incident.
  • Attach root-cause candidates automatically (change events, infra incidents, quota limits).

4) Context-Rich Notifications

Include:

  • Impacted SLO/SLA and current budget burn rate
  • Top failing routes and exemplar traces
  • Region/device breakdowns
  • Recent changes (deploys/config/infra)
  • Runbook link and one-click diagnostics

5) Progressive Escalation

  • Start with Slack/email; escalate to SMS/call only if not acknowledged within target time.
  • Apply per-service quiet hours and automatic silences during maintenance.

Practical Metrics to Track

  • Page volume per week (target declining trend)
  • Percentage of pages that lead to real actions (>70% is a healthy target)
  • Acknowledgement time (TTA) and time to restore (TTR)
  • False positive rate and duplication rate
  • Budget burn alerts avoided by early correlation

analytics graphs on screen

How Tianji Helps

  • Unified feed for events, alerts, and telemetry with a consistent state model and flexible channels.
  • Lightweight server status reporting for CPU, memory, disk, and network: server status reporter.
  • Correlated timeline across checks, metrics, and user events to surface root causes faster.
  • Extensible, open-source architecture so you control data and adapt alerts to your stack.

Key Takeaways

  1. Define SLOs and page on budget burn—not raw spikes.
  2. Correlate symptoms into single incidents and include rich context.
  3. Page only for human-actionable issues; escalate progressively.
  4. Combine synthetic flows with telemetry for proactive detection.
  5. Use Tianji to consolidate signals and reduce MTTR.

Quiet paging is achievable. Start by measuring what matters, suppressing the rest, and investing in context so every page moves responders toward resolution.

Lightweight Telemetry: Count Visitors with Pixel and Simple Requests

· Satu menit membaca

When you just need to confirm real visitor volume without heavy SDKs, cookies, or complex pipelines, a 1x1 pixel or a minimal request is enough. Tianji supports this lightweight telemetry pattern to help you validate traffic safely and reliably.

minimal analytics dashboard

What This Telemetry Is (and Is Not)

  • It is a simple “signal” that a human likely visited a page or executed an action.
  • It is not OpenTelemetry, tracing, or deep behavioral analytics.
  • It favors privacy and performance over granularity.

Common use cases:

  • Confirming documentation traffic and marketing landing page reach
  • Basic pageview counting for self-hosted sites
  • Minimal conversion confirmation (e.g., signup success page)

Option 1: Image Pixel (No JavaScript)

Embed a 1x1 pixel that calls your collector endpoint. The server increments counters based on request metadata.

<!-- Simple pixel beacon: uses GET and works without JS -->
<img
src="https://your-domain.example/api/telemetry/pixel?site=docs&path=/getting-started&ts=1690000000000"
width="1"
height="1"
alt=""
referrerpolicy="strict-origin-when-cross-origin"
loading="eager"
/>

Server recommendations:

  • Count unique visits by a rolling fingerprint from IP range + User-Agent + truncated time bucket
  • Return Cache-Control: no-store to avoid CDN/browser caching
  • Use 204 No Content and a tiny transparent GIF/PNG if needed

network cables representing lightweight transport

Option 2: Minimal Request (sendBeacon/fetch)

When JavaScript is available, a tiny request provides more control and better delivery on page unload.

<script>
// Use sendBeacon when available to improve delivery on unload
(function () {
var url = 'https://your-domain.example/api/telemetry/hit';
var payload = JSON.stringify({ site: 'docs', path: location.pathname });
if (navigator.sendBeacon) {
navigator.sendBeacon(url, payload);
} else {
// Fallback: fire-and-forget fetch
fetch(url, {
method: 'POST',
body: payload,
headers: { 'Content-Type': 'application/json' },
keepalive: true
});
}
})();
// Note: No cookies, no localStorage. Keep it privacy-friendly.
</script>

Server recommendations:

  • Accept both POST (JSON) and GET (query) to handle blockers
  • Normalize UA strings and drop high-cardinality parameters
  • Apply bot heuristics and basic rate limits

Avoiding Caching Pitfalls

  • Add Cache-Control: no-store and Pragma: no-cache on responses
  • For pixel GETs, include a timestamp ts=<epoch> to bust intermediary caches
  • On CDNs, bypass cache for /api/telemetry/* paths

analytics graphs on screen

What You Can Measure Reliably

  • Pageviews and unique visitors (coarse, privacy-preserving)
  • Per-path popularity (docs, blog posts, landing pages)
  • Simple conversions (e.g., reached thank-you page)

What you should not infer:

  • Precise user identity or cross-device journeys
  • Detailed event streams or UI heatmaps

How This Works with Tianji

  • Use the pixel or minimal request to send pageview signals into Tianji
  • Correlate traffic with uptime, response time, and incidents in a single view
  • Keep data ownership: self-hosted, lightweight, and privacy-aware

Useful docs:

team aligning around a simple plan

Key Takeaways

  1. A 1x1 pixel or a tiny request is enough to confirm real visitor volume.
  2. Prefer privacy-friendly defaults: no cookies, no local storage, no PII.
  3. Control caching aggressively to avoid undercounting.
  4. Use sendBeacon/fetch for reliability; fall back to pixel when JS is blocked.
  5. Pipe signals into Tianji to see traffic alongside uptime and performance.

Lightweight telemetry gives you the truth you need—no more, no less—while keeping users fast and private.

Top Metrics to Track for Effective Website Analytics in 2025

· Satu menit membaca

Why Website Analytics Still Matter in 2025

According to McKinsey, companies that extensively use customer analytics are 2.6 times more likely to have higher profit margins than their competitors. Despite the proliferation of digital channels and touchpoints, website analytics remain the cornerstone of understanding user behavior across the entire digital ecosystem.

What began as simple hit counters in the early days of the internet has transformed into sophisticated systems that track complex user journeys. For developers and content creators managing multiple platforms, these insights aren't just nice-to-have statistics but essential decision-making tools.

Three factors make analytics more critical than ever for technical teams:

First, user attention now fragments across dozens of platforms and devices. This fragmentation creates blind spots that only unified tracking can illuminate. When users bounce between your documentation, GitHub repository, and application dashboard, connecting these interactions reveals the complete user journey.

Second, performance metrics directly correlate with business outcomes. A 100ms delay in load time can reduce conversion rates by 7%, according to Amazon's research. For developers, this translates to concrete technical requirements rather than abstract goals.

Third, content strategy depends on granular audience understanding. Generic content satisfies no one. Analytics reveal which documentation pages prevent support tickets, which tutorials drive feature adoption, and which blog posts attract qualified users.

The complexity of modern tech stacks demands simplified monitoring solutions. Tianji's integrated approach helps developers consolidate multiple monitoring needs in one platform, eliminating the need to juggle separate tools for each metric.

Metric 1: Unique Visitors and Session Counts

developer analyzing visitor metrics

Unique visitors represent distinct individuals visiting your site, while sessions count individual visits that may include multiple page views. This distinction matters significantly more than raw pageviews, especially for technical applications.

These metrics rely on several tracking mechanisms, each with technical limitations. Cookies provide user persistence but face increasing browser restrictions. Browser fingerprinting offers cookieless tracking but varies in reliability. IP-based tracking works across devices but struggles with shared networks and VPNs.

For developers, these metrics provide actionable infrastructure insights:

Traffic patterns reveal when users actually access your services, not when you assume they do. A developer documentation site might see traffic spikes during weekday working hours in specific time zones, while a consumer app might peak evenings and weekends. This directly informs when to schedule resource-intensive operations.

The ratio between new and returning visitors indicates retention success. A high percentage of returning visitors to your API documentation suggests developers are actively implementing your solution. Conversely, high new visitor counts with low returns might indicate onboarding friction.

Sudden drops in session counts often signal technical issues before users report them. An unexpected 30% decline might indicate DNS problems, CDN outages, or broken authentication flows.

  • Scale server capacity based on peak usage patterns by time zone
  • Implement intelligent caching for frequently accessed resources
  • Schedule maintenance during genuine low-traffic windows
  • Allocate support resources based on actual usage patterns

Tianji's tracking script provides a lightweight solution for capturing visitor data without the performance penalties that often accompany analytics implementations.

Metric 2: Bounce Rate and Time on Page

Bounce rate measures the percentage of single-page sessions where users leave without further interaction. Time on page calculates the average duration visitors spend on a specific page before navigating elsewhere. Both metrics come with technical limitations worth understanding.

Time on page cannot be accurately measured for the last page in a session without additional event tracking, as the analytics script has no "next page load" to calculate duration. This creates blind spots in single-page applications or terminal pages in your user flow.

For developers and content creators, these metrics serve as diagnostic tools. A documentation page with an 85% bounce rate and 45-second average time might indicate users finding answers quickly and leaving satisfied. The same metrics on a landing page suggest potential problems with messaging or calls-to-action.

Technical issues often reveal themselves through these metrics. Pages with abnormally high bounce rates combined with low time on page (under 10 seconds) frequently indicate performance problems, mobile rendering issues, or content that doesn't match user expectations.

Different content types have distinct benchmark ranges:

Page TypeExpected Bounce RateExpected Time on PageWhen to Investigate
Documentation Home40-60%1-3 minutesBounce rate >70%, Time < 30 seconds
API Reference60-80%2-5 minutesTime < 1 minute, especially with high bounce
Tutorial Pages30-50%4-8 minutesBounce rate > 60%, Time < 2 minutes
Landing Pages40-60%1-2 minutesBounce rate > 75%, Time < 30 seconds

When these metrics indicate potential problems, Tianji's monitoring capabilities can help identify specific technical issues affecting user engagement, from slow API responses to client-side rendering problems.

Metric 3: Conversion Rate and Goal Completions

conversion funnel on whiteboard

Conversion rate measures the percentage of visitors who complete a desired action, while goal completions count the total number of times users complete specific objectives. For technical teams, conversions extend far beyond sales to include meaningful developer interactions.

Implementing conversion tracking requires thoughtful technical setup. Event listeners must capture form submissions, button clicks, and custom interactions. For single-page applications, virtual pageviews need configuration to track state changes. Custom events require consistent naming conventions to maintain data integrity.

Developer-focused conversions worth tracking include:

  • Documentation engagement (completing a multi-page tutorial sequence)
  • SDK or library downloads (tracking both initial and update downloads)
  • API key generation and actual API usage correlation
  • GitHub interactions (stars, forks, pull requests)
  • Sandbox or demo environment session completion rates
  • Support documentation searches that prevent ticket creation

Setting up proper conversion funnels requires identifying distinct stages in the user journey. For a developer tool, this might include: landing page view → documentation visit → trial signup → API key generation → first successful API call → repeated usage. Each step should be tracked as both an individual event and part of the complete funnel.

The technical implementation requires careful consideration of when and how events fire. Client-side events might miss server errors, while server-side tracking might miss client interactions. Tianji's event tracking capabilities provide solutions for capturing these important user interactions across both client and server environments.

Metric 4: Traffic Sources and Referral Paths

Traffic sources categorize where visitors originate from: direct (typing your URL or using bookmarks), organic search (unpaid search engine results), referral (links from other websites), social (social media platforms), email (email campaigns), and paid (advertising). These sources are identified through HTTP referrer headers and UTM parameters, though referrer stripping and "dark social" (private sharing via messaging apps) create attribution challenges.

For developers and content creators, traffic source data drives strategic decisions:

Developer community referrals reveal which forums, subreddits, or Discord servers drive engaged visitors. A spike in traffic from Stack Overflow might indicate your documentation answers common questions, while GitHub referrals suggest integration opportunities.

Documentation link analysis shows which pages receive external references. Pages frequently linked from other sites often contain valuable information worth expanding, while pages with high direct traffic but few referrals might need better internal linking.

Content performance varies dramatically by platform. Technical tutorials might perform well when shared on Reddit's programming communities but generate little engagement on LinkedIn. This informs not just where to share content, but what type of content to create for each channel.

To analyze referral paths effectively:

  1. Identify top referring domains by volume and engagement quality
  2. Examine the specific pages linking to your site to understand context
  3. Analyze user behavior patterns from each referral source (pages visited, time spent)
  4. Determine which sources drive valuable conversions, not just traffic
  5. Implement proper UTM parameters for campaigns to ensure accurate attribution

For technical products, GitHub stars, Hacker News mentions, and developer forum discussions often drive more qualified traffic than general social media. Tianji's telemetry features help track these user interactions across multiple touchpoints, providing a complete picture of how developers discover and engage with your tools.

Metric 5: Uptime and Server Response Time

technician checking server uptime

Uptime measures the percentage of time a service remains available, while server response time quantifies how long the server takes to respond to a request before content begins loading. These metrics form the foundation of all other analytics—when your site is down or slow, other metrics become meaningless.

Monitoring these metrics involves two complementary approaches. Synthetic monitoring uses automated tests from various locations to simulate user requests at regular intervals, providing consistent benchmarks. Real User Monitoring (RUM) captures actual user experiences, revealing how performance varies across devices, browsers, and network conditions.

Establishing meaningful baselines requires collecting data across different time periods and conditions. A response time of 200ms might be excellent for a data-heavy dashboard but problematic for a simple landing page. Geographic monitoring from multiple locations reveals CDN effectiveness and regional infrastructure issues that single-point monitoring would miss.

Proactive issue detection depends on properly configured alerting thresholds. Rather than setting arbitrary values, base thresholds on statistical deviations from established patterns. A 50% increase in response time might indicate problems before users notice performance degradation.

Poor uptime and slow response times create cascading effects across other metrics. A 1-second delay correlates with 7% lower conversion rates, 11% fewer page views, and 16% decreased customer satisfaction. For technical applications, slow API responses lead to timeout errors, failed integrations, and abandoned implementations.

Technical improvements include implementing CDNs for static assets, optimizing database queries through proper indexing, leveraging edge caching for frequently accessed resources, and implementing circuit breakers to prevent cascading failures.

Tianji's server status reporter provides a straightforward solution for tracking these critical metrics without complex setup, making it accessible for teams without dedicated DevOps resources.

Metric 6: Custom Events and Telemetry Data

Custom events track specific user interactions you define, while telemetry data encompasses comprehensive behavioral and performance information collected across platforms. These metrics extend beyond standard analytics to reveal how users actually interact with applications in real-world conditions.

Implementing custom event tracking requires thoughtful technical planning. Event naming conventions should follow hierarchical structures (category:action:label) for consistent analysis. Parameter structures must balance detail with maintainability—tracking too many parameters creates analysis paralysis, while insufficient detail limits insights.

Data volume considerations matter significantly. Tracking every mouse movement generates excessive data with minimal value, while tracking only major conversions misses important interaction patterns. The right balance captures meaningful interactions without performance penalties or storage costs.

Valuable custom events for developers include:

  • Feature discovery patterns (which features users find and use)
  • Error occurrences with context (what users were doing when errors occurred)
  • Recovery attempts after errors (how users try to resolve problems)
  • Configuration changes and preference settings (how users customize tools)
  • Feature usage frequency and duration (which capabilities provide ongoing value)
  • Navigation patterns within applications (how users actually move through interfaces)

Telemetry differs from traditional web analytics by capturing cross-platform behavior and technical performance metrics. While web analytics might show a user visited your documentation, telemetry reveals they subsequently installed your SDK, encountered an integration error, consulted specific documentation pages, and successfully implemented your solution.

Privacy considerations require implementing data minimization principles. Collect only what serves clear analytical purposes, anonymize where possible, and provide transparent opt-out mechanisms. Tianji's application tracking capabilities offer comprehensive telemetry collection while respecting user privacy through configurable data collection policies.

Choosing the Right Tools for 2025

comparing analytics tool interfaces

Selecting analytics tools requires evaluating technical considerations beyond marketing features. Implementation complexity, data ownership, and integration capabilities often matter more than flashy dashboards or advanced visualizations.

Key evaluation criteria for analytics tools include:

  • Data ownership and storage location (self-hosted vs. third-party servers)
  • Privacy compliance features (consent management, data anonymization)
  • Self-hosting options for sensitive environments or regulatory requirements
  • API access for extracting raw data for custom analysis
  • Data portability for avoiding vendor lock-in
  • Custom event flexibility and parameter limitations
  • Integration with existing development workflows and tools
  • Performance impact on monitored applications (script size, execution time)
  • Sampling methodology for high-traffic applications
  • Real-time capabilities vs. batch processing limitations

The analytics landscape offers distinct tradeoffs between different approaches:

Tool TypeData OwnershipImplementation ComplexityCustomizationBest For
Open-Source Self-HostedComplete ownershipHigh (requires infrastructure)Unlimited with technical skillsPrivacy-focused teams, regulated industries
Open-Source CloudHigh with provider accessMediumGood with some limitationsTeams wanting control without infrastructure
Proprietary SpecializedLimited with vendor policiesLow for specific featuresLimited to provided optionsTeams needing specific deep capabilities
Proprietary IntegratedLimited with vendor policiesLow for basic, high for advancedVaries by platformTeams prioritizing convenience over control

Consolidated tooling offers significant technical advantages. Reduced implementation overhead means fewer scripts impacting page performance. Consistent data collection methodologies eliminate discrepancies between tools measuring similar metrics. Simplified troubleshooting allows faster resolution when tracking issues arise.

The most effective approach often combines a core integrated platform for primary metrics with specialized tools for specific needs. Tianji's documentation demonstrates its all-in-one approach to analytics, monitoring, and telemetry, providing a foundation that can be extended with specialized tools when necessary.