Real-Time Performance Monitoring: From Reactive to Proactive Infrastructure Management

In modern cloud-native architectures, system performance issues can cause severe impact within seconds. By the time users start complaining about slow responses, the problem may have persisted for minutes or even longer. Real-time performance monitoring is no longer optional—it's essential for ensuring business continuity.
Tianji, as an all-in-one observability platform, provides a complete real-time monitoring solution from data collection to intelligent analysis. This article explores how real-time performance monitoring transforms infrastructure management from reactive response to proactive control.
Why Real-Time Monitoring Matters
Traditional polling-based monitoring (e.g., sampling every 5 minutes) is no longer sufficient in rapidly changing environments:
- User Experience First: Modern users expect millisecond-level responses; any delay can lead to churn
- Dynamic Resource Allocation: Cloud environments scale rapidly, requiring real-time state tracking
- Cost Optimization: Timely detection of performance bottlenecks prevents over-provisioning
- Failure Prevention: Real-time trend analysis enables action before issues escalate
- Precise Diagnosis: Performance problems are often fleeting; real-time data is the foundation for accurate diagnosis
Tianji's Real-Time Monitoring Capabilities
1. Multi-Dimensional Real-Time Data Collection
Tianji integrates three core monitoring capabilities to form a complete real-time observability view:
Website Analytics
# Real-time visitor tracking
- Real-time visitor count and geographic distribution
- Page load performance metrics (LCP, FID, CLS)
- User behavior flow tracking
- API response time statistics
Uptime Monitor
# Continuous availability checking
- Second-level heartbeat detection
- Multi-region global probing
- DNS, TCP, HTTP multi-protocol support
- Automatic failover verification
Server Status
# Infrastructure metrics streaming
- Real-time CPU, memory, disk I/O monitoring
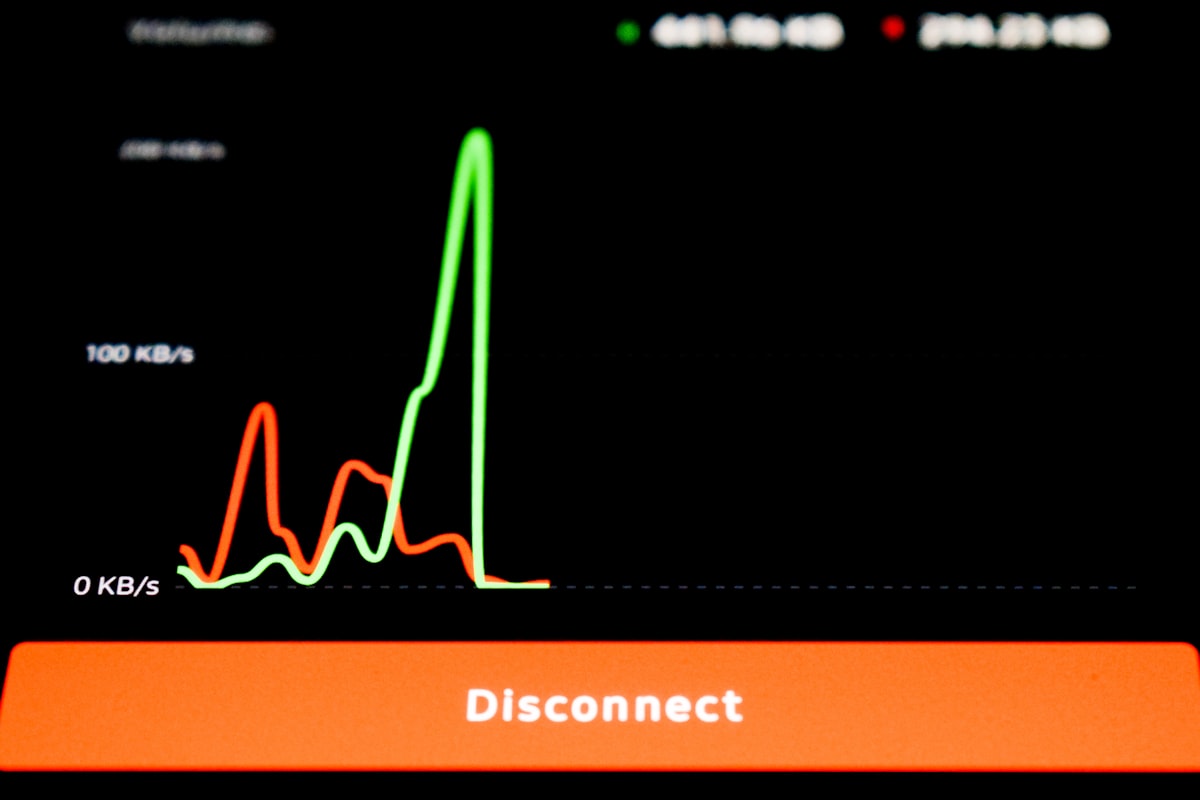
- Network traffic and connection status
- Process-level resource consumption
- Container and virtualization metrics
2. Real-Time Data Stream Processing Architecture
Tianji employs a streaming data processing architecture to ensure monitoring data timeliness:
Data Collection (< 1s)
    ↓
Data Aggregation (< 2s)
    ↓
Anomaly Detection (< 3s)
    ↓
Alert Trigger (< 5s)
    ↓
Notification Push (< 7s)
From event occurrence to team notification, the entire process completes within 10 seconds, providing valuable time for rapid response.
3. Intelligent Performance Baselines and Anomaly Detection
Static thresholds often lead to numerous false positives. Tianji supports dynamic performance baselines:
- Adaptive Thresholds: Automatically calculate normal ranges based on historical data
- Time-Series Pattern Recognition: Identify cyclical fluctuations (e.g., weekday vs weekend traffic)
- Multi-Dimensional Correlation: Assess anomaly severity by combining multiple metrics
- Trend Prediction: Forecast future resource needs based on current trends
// Example: Dynamic baseline calculation
{
  metric: "cpu_usage",
  baseline: {
    mean: 45.2,      // Historical average
    stdDev: 8.3,     // Standard deviation
    confidence: 95,  // Confidence interval
    threshold: {
      warning: 61.8,   // mean + 2*stdDev
      critical: 70.1   // mean + 3*stdDev
    }
  }
}

Best Practices for Real-Time Monitoring
Building an Effective Monitoring Strategy
- Define Key Performance Indicators (KPIs)
Choose metrics that truly impact business outcomes, avoiding monitoring overload:
- User Experience Metrics: Page load time, API response time, error rate
- System Health Metrics: CPU/memory utilization, disk I/O, network latency
- Business Metrics: Order conversion rate, payment success rate, active users
- Layered Monitoring Architecture
┌──────────────────────────────────────────┐
│  Business Layer: Conversion, Satisfaction│
├──────────────────────────────────────────┤
│  Application Layer: API Response, Errors │
├──────────────────────────────────────────┤
│  Infrastructure: CPU, Memory, Network    │
└──────────────────────────────────────────┘
Monitor layer by layer from top to bottom, ensuring issues can be quickly located to specific levels.
- Real-Time Alert Prioritization
Not all anomalies require immediate human intervention:
- P0 - Critical: Impacts core business, requires immediate response (e.g., payment system outage)
- P1 - High: Affects some users, requires prompt handling (e.g., regional access slowdown)
- P2 - Medium: Doesn't affect business but needs attention (e.g., disk space warning)
- P3 - Low: Informational alerts, periodic handling (e.g., certificate expiration notice)
Performance Optimization Case Study
Scenario: E-commerce Website Traffic Surge Causing Slowdown
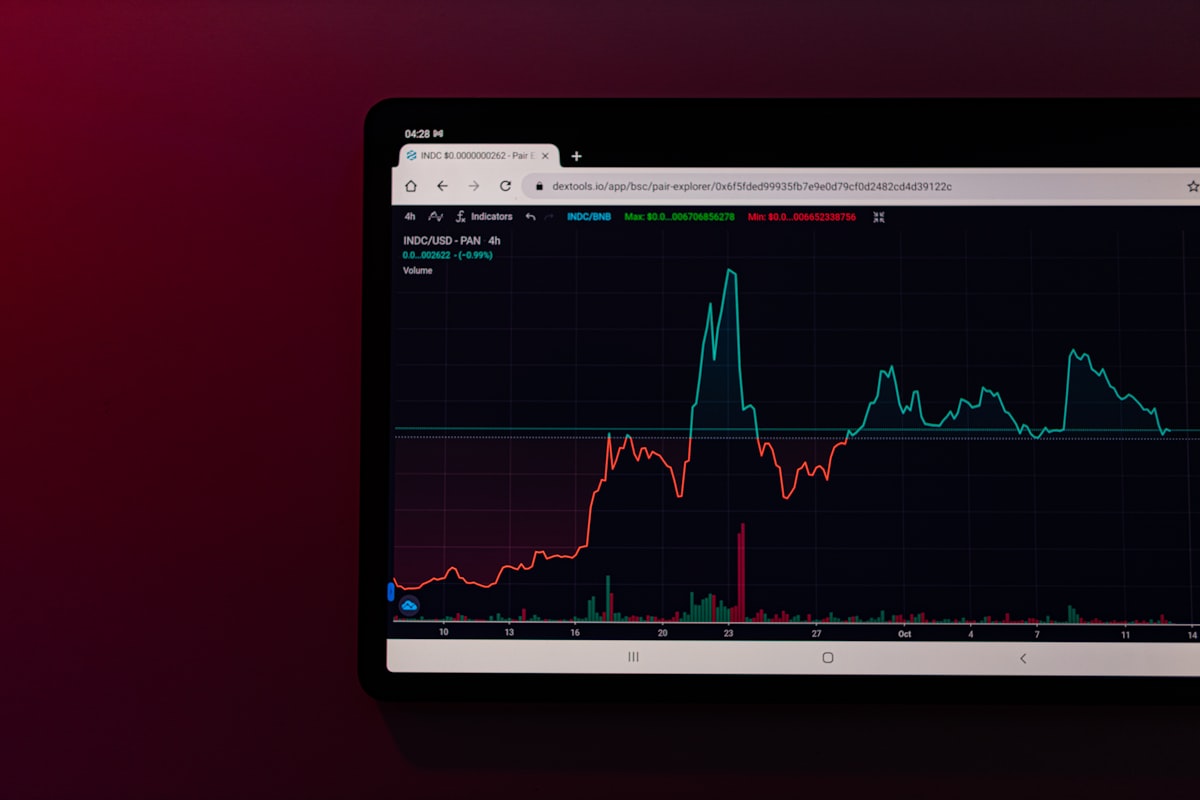
Through Tianji's real-time monitoring dashboard, the team observed:
Timeline: 14:00 - 14:15

14:00 - Normal traffic (1000 req/min)
  ↓
14:03 - Traffic begins to rise (1500 req/min)
  ├─ Website Analytics: Page load time increased from 1.2s to 2.8s
  ├─ Server Status: API server CPU reached 85%
  └─ Uptime Monitor: Response time increased from 200ms to 1200ms
  ↓
14:05 - Automatic alert triggered
  └─ Webhook notification → Auto-scaling script executed
  ↓
14:08 - New instances online
  ├─ Traffic distributed across 5 instances
  └─ CPU reduced to 60%
  ↓
14:12 - Performance restored to normal
  └─ Response time back to 250ms
Key Benefits:
- Issue detection time: < 5 minutes (traditional monitoring may take 15-30 minutes)
- Automated response: Auto-scaling without manual intervention
- Impact scope: Only 10% of users experienced slight delay
- Business loss: Nearly zero
Quick Start: Deploying Tianji Real-Time Monitoring
Installation and Configuration
# 1. Download and start Tianji
wget https://raw.githubusercontent.com/msgbyte/tianji/master/docker-compose.yml
docker compose up -d

# 2. Access the admin interface
# http://localhost:12345
# Default credentials: admin / admin (change password immediately)
Configuring Real-Time Monitoring
Step 1: Add Website Monitoring
// Embed tracking code in your website
<script
  src="https://your-tianji-domain/tracker.js"
  data-website-id="your-website-id"
></script>
Step 2: Configure Server Monitoring
# Install server monitoring client
curl -o tianji-reporter https://tianji.example.com/download/reporter
chmod +x tianji-reporter

# Configure and start
./tianji-reporter \
  --workspace-id="your-workspace-id" \
  --name="production-server-1" \
  --interval=5
Step 3: Set Up Uptime Monitoring
In the Tianji admin interface:
- Navigate to "Monitors" page
- Click "Add Monitor"
- Configure check interval (recommended: 30 seconds)
- Set alert thresholds and notification channels
Step 4: Configure Real-Time Alerts
# Webhook notification example
notification:
  type: webhook
  url: https://your-alert-system.com/webhook
  method: POST
  payload:
    level: "{{ alert.level }}"
    message: "{{ alert.message }}"
    timestamp: "{{ alert.timestamp }}"
    metrics:
      cpu: "{{ metrics.cpu }}"
      memory: "{{ metrics.memory }}"
      response_time: "{{ metrics.response_time }}"
Advanced Techniques: Building Predictive Monitoring
1. Leveraging Historical Data for Capacity Planning
Tianji's data retention and analysis features help teams forecast future needs:
- Analyze traffic trends over the past 3 months
- Identify seasonal and cyclical patterns
- Predict resource needs for holidays and promotional events
- Scale proactively, avoiding last-minute scrambles
2. Correlation Analysis: From Symptom to Root Cause
When multiple metrics show anomalies simultaneously, Tianji's correlation analysis helps quickly pinpoint root causes:
Anomaly Pattern Recognition:

Symptom: API response time increase
  ├─ Correlated Metric 1: Database connection pool utilization at 95%
  ├─ Correlated Metric 2: Slow query count increased 3x
  └─ Root Cause: Unoptimized SQL queries causing database pressure

→ Recommended Actions:
  1. Enable query caching
  2. Add database indexes
  3. Optimize hotspot queries
3. Performance Benchmarking and Continuous Improvement
Regularly conduct performance benchmarks to establish a continuous improvement cycle:
Benchmarking Process:

1. Record current performance baseline
   ├─ P50 response time: 150ms
   ├─ P95 response time: 500ms
   └─ P99 response time: 1200ms

2. Implement optimization measures
   └─ Examples: Enable CDN, optimize database queries

3. Verify optimization results
   ├─ P50 response time: 80ms  (-47%)
   ├─ P95 response time: 280ms (-44%)
   └─ P99 response time: 600ms (-50%)

4. Solidify improvements
   └─ Update performance baseline, continue monitoring
Common Questions and Solutions
Q: Does real-time monitoring increase system load?
A: Tianji's monitoring client is designed to be lightweight:
- Client CPU usage < 1%
- Memory footprint < 50MB
- Network traffic < 1KB/s (per server)
- Batch data upload reduces network overhead
Q: How to avoid alert storms?
A: Tianji provides multiple alert noise reduction mechanisms:
- Alert Aggregation: Related alerts automatically merged
- Silence Period Settings: Avoid duplicate notifications
- Dependency Management: Downstream failures don't trigger redundant alerts
- Intelligent Prioritization: Automatically adjust alert levels based on impact scope
Q: How to set data retention policies?
A: Recommended data retention strategy:
Real-time data: Retain 7 days (second-level precision)
  └─ Used for: Real-time analysis, troubleshooting

Hourly aggregated data: Retain 90 days
  └─ Used for: Trend analysis, capacity planning

Daily aggregated data: Retain 2 years
  └─ Used for: Historical comparison, annual reports
Conclusion
Real-time performance monitoring is not just a technical tool—it represents a shift in operational philosophy from reactive response to proactive prevention, from post-incident analysis to real-time decision-making.
Through Tianji's unified monitoring platform, teams can:
- Detect Issues Early: From event occurrence to notification response in < 10 seconds
- Quickly Identify Root Causes: Multi-dimensional data correlation analysis
- Intelligent Alert Noise Reduction: Reduce invalid alerts by over 70%
- Predictive Operations: Forecast future needs based on historical trends
- Continuous Performance Optimization: Establish closed-loop performance improvement
In modern cloud-native environments, real-time monitoring has become a core competitive advantage for ensuring business continuity and user experience. Start using Tianji today to let data drive your operational decisions and eliminate performance issues before they escalate.
Get Started with Tianji Real-Time Monitoring: Deploy in just 5 minutes and bring your infrastructure into the era of real-time observability.